 I-COST
The Difference Between What You Spent and What You Will Spend
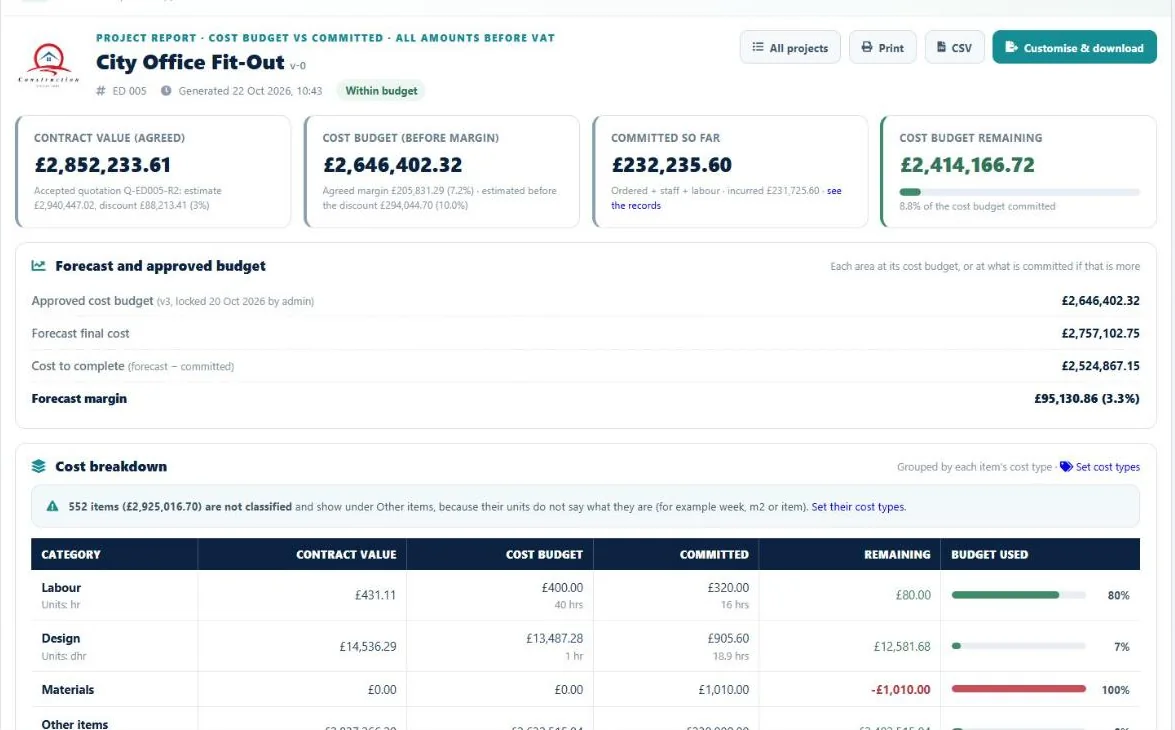
In construction commercial management, Forecast Final Cost (FFC) is the single most important metric for protecting company solvency. While financial accountants focus on past transactions recorded in the general ledger, quantity surveyors and commercial directors focus on where the project will finish financially on the day of practical completion.
If a commercial team only tracks money spent to date, they cannot anticipate cash flow crunches or margin collapses. Calculating a robust FFC through monthly Cost Value Reconciliation (CVR) processes provides the visibility necessary to manage risk proactively.
The Formula for Forecast Final Cost
Calculating FFC is a rigorous process of synthesising known costs with future projections:
FFC = Actual Cost to Date + Uninvoiced Accruals + Open Committed Orders + Cost to Complete (CTC) + Commercial Risk Contingency
- Actual Cost to Date: Certified invoices paid or processed.
- Accruals: Work done or deliveries received for which no invoice has yet arrived.
- Open Committed Orders: The unfulfilled balance of active purchase orders.
- Cost to Complete (CTC): The quantified estimate of all remaining labour, plant, material, and subcontract resources required to achieve practical completion.
- Commercial Risk Contingency: Realistic financial provisions for disputed variations, potential liquidated damages (LADs), or weather-sensitive operations.
The CVR Structure: Aligning Value and Cost
A monthly Cost Value Reconciliation compares the Anticipated Final Revenue (AFR) against the Forecast Final Cost (FFC) to project outturn gross margin:
| Project Milestone | Contract Value (Revenue) | Cumulative Cost to Date | Forecast Cost to Complete | Forecast Final Cost | Forecast Final Margin |
|---|---|---|---|---|---|
| Tender Baseline | £2,200,000 | £0 | £1,870,000 | £1,870,000 | £330,000 (15.0%) |
| Month 3 CVR | £2,260,000 (Includes agreed vars) | £520,000 | £1,385,000 | £1,905,000 | £355,000 (15.7%) |
| Month 6 CVR | £2,340,000 | £1,180,000 | £785,000 | £1,965,000 | £375,000 (16.0%) |
| Month 9 CVR | £2,385,000 | £1,760,000 | £275,000 | £2,035,000 | £350,000 (14.7%) |
How to Prevent "CVR Manipulation"
One common danger in commercial reporting is front-loading margin—assuming overly optimistic costs to complete early in the programme, only for outturn profit to collapse during the final two months. To prevent this:
- Always substantiate Cost to Complete against the revised project programme.
- Do not recognize revenue for unagreed variations until written approval or formal valuation is secured.
- Ensure physical progress on site aligns with certified payment applications.
Key Takeaways
- Protect Margin from Day One: Margin leakage occurs incrementally; establish committed cost controls before placing orders.
- Enforce Written Protocols: Verbal site requests carry 100% contractor risk. Require written confirmations of verbal instructions (CAIs) immediately.
- Bridge the Estimating-Buying Gap: Ensure the tender estimate baseline directly governs purchase order authorization and live project tracking.
Explore how I-Cost supports construction commercial management
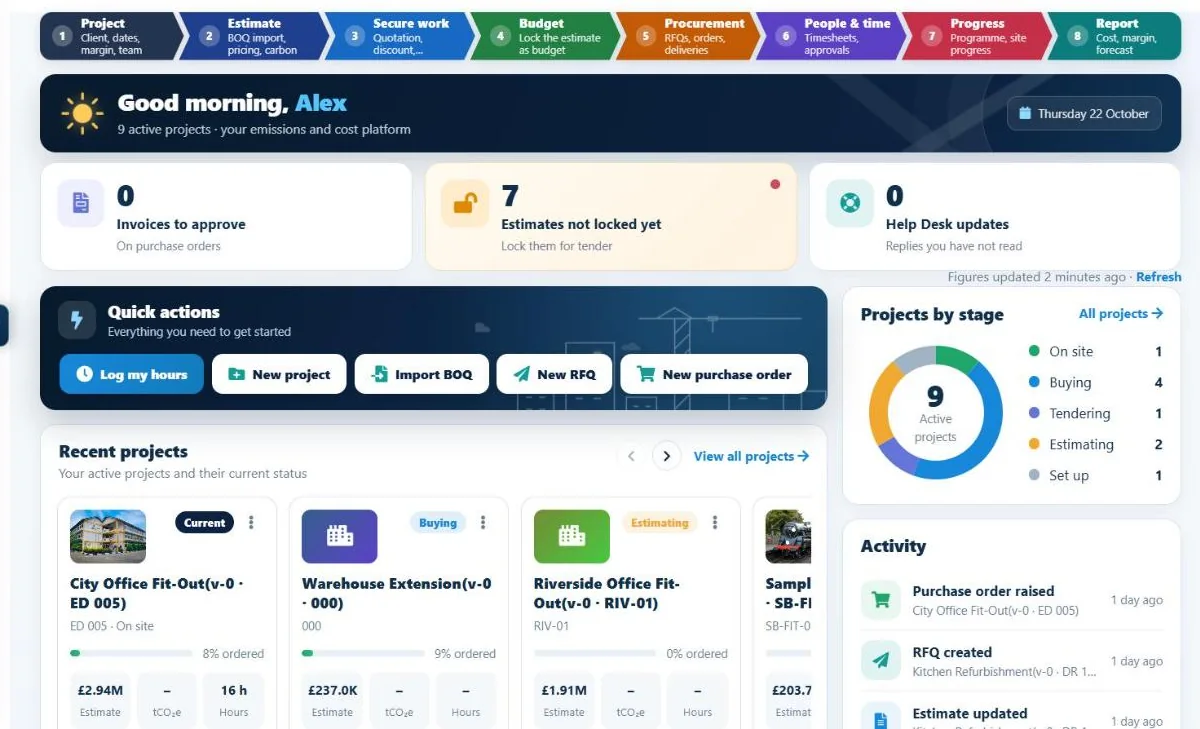
I-Cost brings your client's BOQ, estimate, supplier quotations, purchase orders, mobile site timesheets, and whole life carbon into one connected system for UK contractors, calculating live forecast margin from day one.
Frequently Asked Questions
What is the formula for Forecast Final Cost (FFC)?
FFC = Actual Cost to Date + Accruals + Committed Cost Remaining + Uncommitted Estimated Cost to Complete (CTC) + Known Risk Allowances.
What is a Cost Value Reconciliation (CVR)?
A CVR is a monthly commercial report prepared by quantity surveyors that compares cumulative costs against cumulative revenue/value earned, establishing the actual profitability to date and forecasting outturn margin at project completion.
Why is Forecast Final Cost superior to historical spend reporting?
Historical spend merely reflects what has been paid previously. Forecast Final Cost provides an forward-looking projection of total outturn cost, allowing commercial managers to take corrective measures while the project is still underway.